


Arizona Auditor General Home Page
We Make a Positive Difference
We help government work better by analyzing governmental operations and recommending improvements. Our fiscal year 2025 results:
* reports include audits, reviews, investigations, alerts, and followups.
What's New
As part of their responsibility to prevent and detect fraud, Sahuarita Unified School District (District) officials took appropriate action by reporting to us alleged financial misconduct by Denise Montano (aka...
Department took steps to implement recommendations from its 2024 sunset review but its Low Income Housing Tax Credit program monitoring did not ensure some housing units at properties we reviewed...
As of June 2026, the Authority provided more than $2.3 billion in loans and more than $243.3 million in grants for water related projects and had appropriately administered the Clean...
The Arizona State Schools for the Deaf and the Blind had multiple operational, financial, educational, and compliance issues, potentially impacting student/staff safety and educational quality, reducing monies available for its operations...
Featured Reports

COVID-19 Spending Reports
Followup—Arizona school districts’ and charter schools’, and ADE’s discretionary, COVID-19 federal relief spending—through June 30, 2022...
Arizona Auditor General Special COVID-19 Funding Report, November 2022...
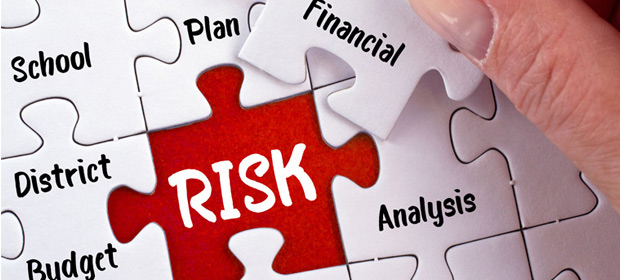
School District Financial Risk Analysis
As of January 2026, 9 of 207 analyzed Arizona school districts are at the highest financial risk, and 9 are approaching the highest-risk category. This represents an increase from last year’s report when our analysis identified 2 highest-risk school districts and 7 approaching the highest-risk category.

School District Spending Analysis
In FY 2025, districts spent nearly $53 million less on instruction than the prior year, and for the third consecutive year, the State-wide instructional spending percentage (ISP) fell to a new low—52.1%. Although the State average teacher salary increased slightly to $65,613, average teacher salaries declined at 95 districts. Additionally, one-third of districts are potentially at higher financial risk because of declining student enrollment and related funding.